
AveSoft
A proprietary flight control and inspection software platform managing the entire inspection lifecycle — from drone operation and data collection to AI-assisted analysis and automated reporting with integrated asset visualization.
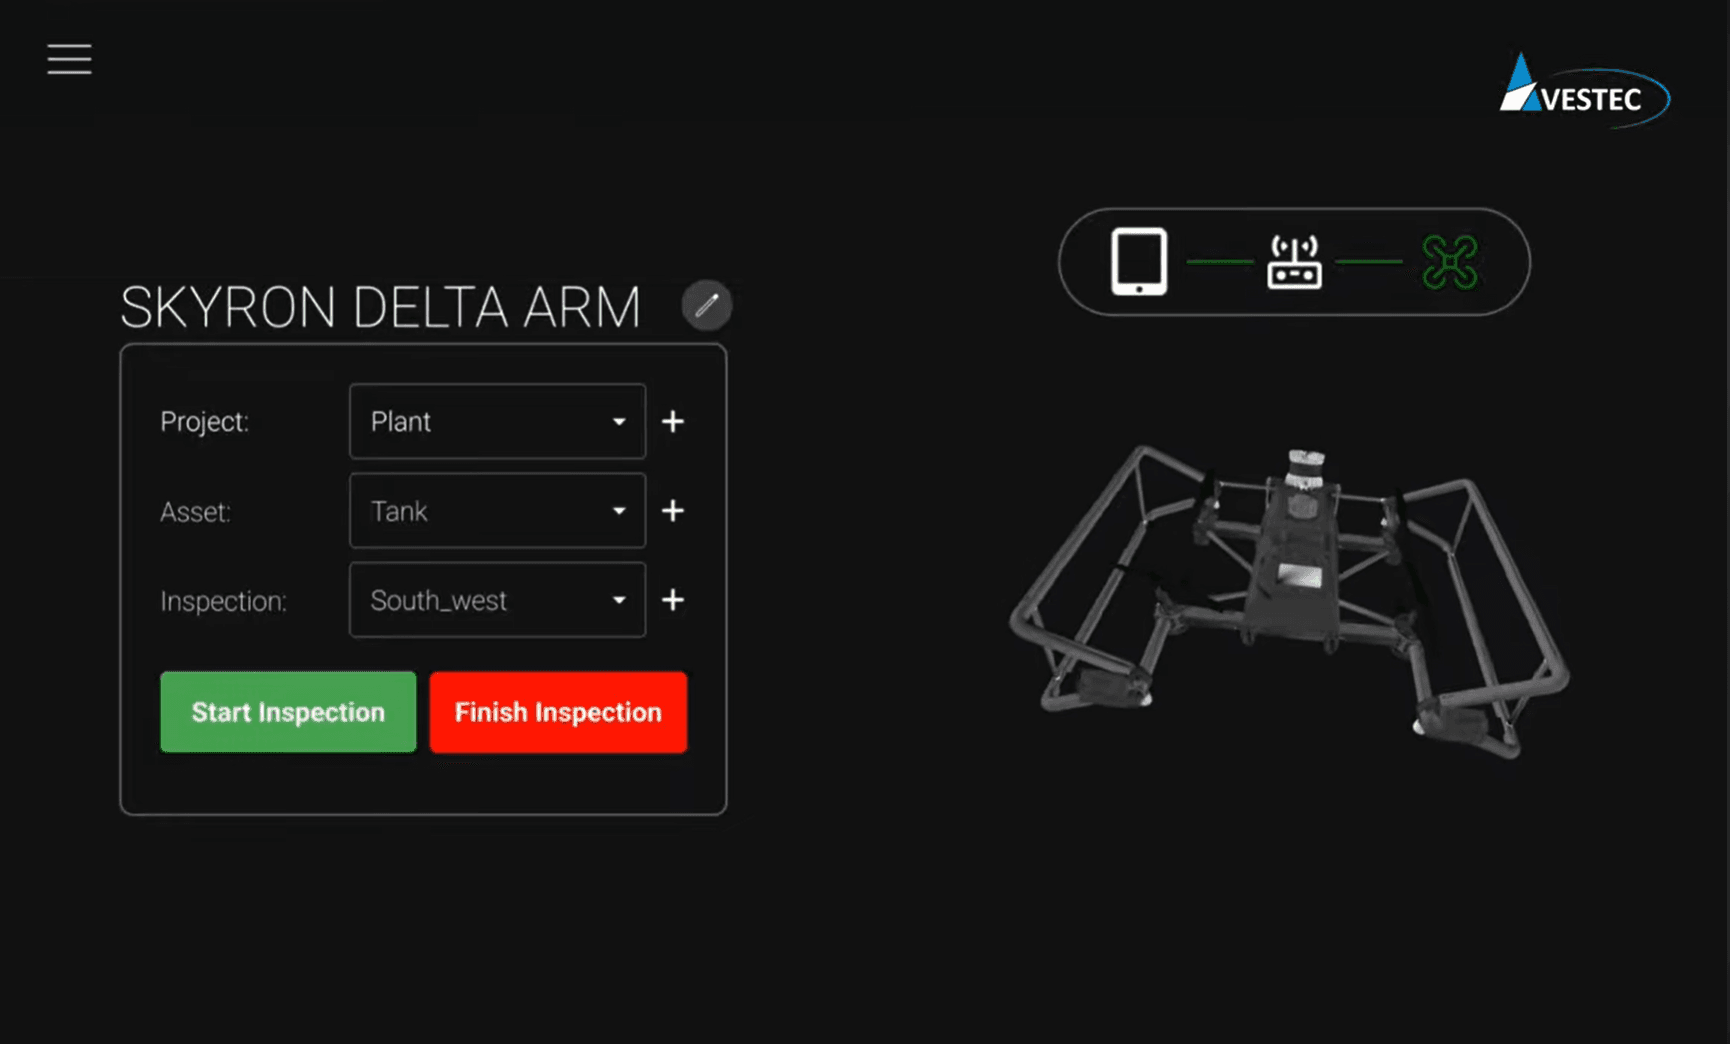
Operation and Data Collection
Flight control and payload management interface supporting a dual-operator workflow. The pilot controls the drone, while the inspector manages the inspection payload — adjusting lighting, couplant delivery, payload arm positioning, and probe engagement while capturing inspection measurements in the field.
Data Analysis and Reporting
Desktop application for post-inspection data analysis and reporting, enabling review of point clouds, thickness heatmaps, and measurements with automated PDF report generation aligned to client specifications.

Inspection Workflow
From project setup to final report — a structured, repeatable process.
Set up the inspection project with asset and location details
Pilot navigates while Inspector controls the payload and captures data
Measurements are organized within the Project > Asset > Inspection hierarchy
Export PDF reports and data tables directly from the tablet on-site
LiDAR Point Cloud
Real-time 3D point cloud generated during inspection provides spatial context for measurements, helping inspectors accurately locate findings and document inspection coverage.
Drag to rotate · scroll to zoom
See the hardware behind the software
AveSoft pairs with Skyron 2 and its modular payload system for a complete inspection solution.